Economic Freedom and Economic Growth: Pennsylvania and South Dakota
By Robert E. Wright, Nef Family Chair of Political Economy, Augustana University, Sioux Falls, S.D.
For the Pennsylvania Economics Association Conference in Kutztown, Pa., 30 May – 1 June 2019
NOTA BENE: I've been blogging extensively for the AIER, partly in support of my new book, Financial Exclusion, which you can (should?) buy here: https://www.amazon.com/gp/product/B07SC4CBDD.
Paper and slides:
Pennsylvania and South Dakota are not as dissimilar as they
might at first seem. While South Dakota is physically bigger (76K vs. 45K
square miles) and flatter, both states share the same basic rectangular shape
and, more importantly, they both have metropoles at either end, Philadelphia
and Sioux Falls in the east and Pittsburgh and Rapid City in the west, and a
capital on a major river in the middle, Pierre on the Missouri and Harrisburg
on the Susquehanna. Euroamerican Pennsylvania is also two centuries older (c.
1680) than Euroamerican South Dakota (c. 1860), which helps to explain its much
higher population (13 vs. .9 million) and population density (285 vs. 11 people
per square mile).
Per capita income is also higher in Pennsylvania ($51K vs.
$48K) but its economic freedom score is somewhat lower (7.2 vs. 8.0). This is
interesting because many people believe, on the basis of natural experiments
like East and West Germany and North and South Korea, that economic freedom
causes economic growth. Take that as you may, the two variables are incontestably
highly correlated. Why, then, does South Dakota not have a higher per capita
income than Pennsylvania?
Three major hypotheses come to mind. The first is that what
really matters for growth is something other than economic freedom. In other
words, South Dakota suffers from some problem or problems that Pennsylvania
does not.
The second hypothesis is that specific types of freedom are
more important to growth than the overall freedom score and that Pennsylvania
is freer than South Dakota in those specific growth areas.
The third hypothesis is that the reported economic freedom
scores are incorrect and Pennsylvania is economically freer, or South Dakota is
economically less free, than measured.
I find little support for the first two hypotheses but a
compelling story in support of the third, specifically the proposition that
South Dakota’s freedom score, or its population, should be adjusted downward.
Numerous studies show a very high level of correlation
between economic freedom and per capita income. Parsing out causation is harder
but it does make sense that places with lower taxes, fewer regulations, more
fiscal responsibility, less onerous and expensive entry barriers, and so forth
would create more incentives for people to work harder and smarter and hence
lead to higher income growth. The best causal evidence comes from natural
experiments at the national level. So, for example, Korea and Germany were
divided for exogenous reasons and one part endowed with relatively more
economic freedom than the other part. As predicted, the freer parts, South
Korea and West Germany, did much better economically than their relatively
unfree counterparts.
But there is no such conclusive proof that economic freedom
causes growth at the state level, so we should explore the possibility that
something other than economic freedom might explain South Dakota’s relatively
lower income. I cannot find anything, however, that makes sense, at least when
the facts about both states are known. For instance, sometimes people intuit
that South Dakota suffers because of its location, its size, its lack of fossil
fuel production, its supposed reliance on agriculture, or its lack of
diversity, finance, tourism, or education. These are all wrong and some are
even silly.
For example, South Dakota happens to be in the exact center
of the continent. Its average distance to all the inland markets is therefore
shorter than Pennsylvania’s. Consider, for example, the average travel distance
from Sioux Falls to New York (1,361 miles), Chicago (573), Houston (1,083), and
Los Angeles (1,640), 1,164 miles, compared to Philadelphia (94 miles; 759
miles; 1,549 miles; 2,711 miles), which is 1,278 miles.
Size per se can’t matter. Many of the world’s richest
countries, like Iceland and Monaco, are small. The population of South Dakota
is about the same as that of my former home county, Montgomery, an affluent set of suburbs and
exurbs just north of Philadelphia.
It is true that South Dakota does not produce fossil fuels.
If you think it does, you have it confused with North Dakota, the oil fields of
which do nothing for South Dakota’s economy according to a careful study by the
Minneapolis Fed. South Dakota gets much of its electricity from hydro plants along
the Missouri River and, like most states, imports gasoline, but mixes it with
home grown, and unsubsidized, ethanol.
South Dakota is, however, not dependent on agriculture. Not
even its farmers and ranchers are, as most learned in the 1980s that it is
important to diversify into financial assets, town jobs, and hunting leases.
Agriculture represents only about 6 percent of state GDP, much more than
Pennsylvania’s .5%, but much less than the FIRE industry (finance, insurance,
and real estate) in either place. In fact, South Dakota is much more reliant on
FIRE (26% of GDP) than Pennsylvania (19% of GDP) is!
And tourism is much bigger in South Dakota, where it
accounts for 6.4 percent of employment versus only 3.9 percent in Pennsylvania.
The population of South Dakota is not as diverse as that of
Pennsylvania by some measures but the metropoles, particularly Sioux Falls, are
amazingly diverse, and in diverse ways. There are more straight up Africans in
Sioux Falls than African-Americans, for example. Most are Christians relocated
from Ethiopia and Somalia by Lutheran Social Services. South Dakota has
actually elected two people of Lebanese descent, one Democrat and one
Republican, to the U.S. Senate!
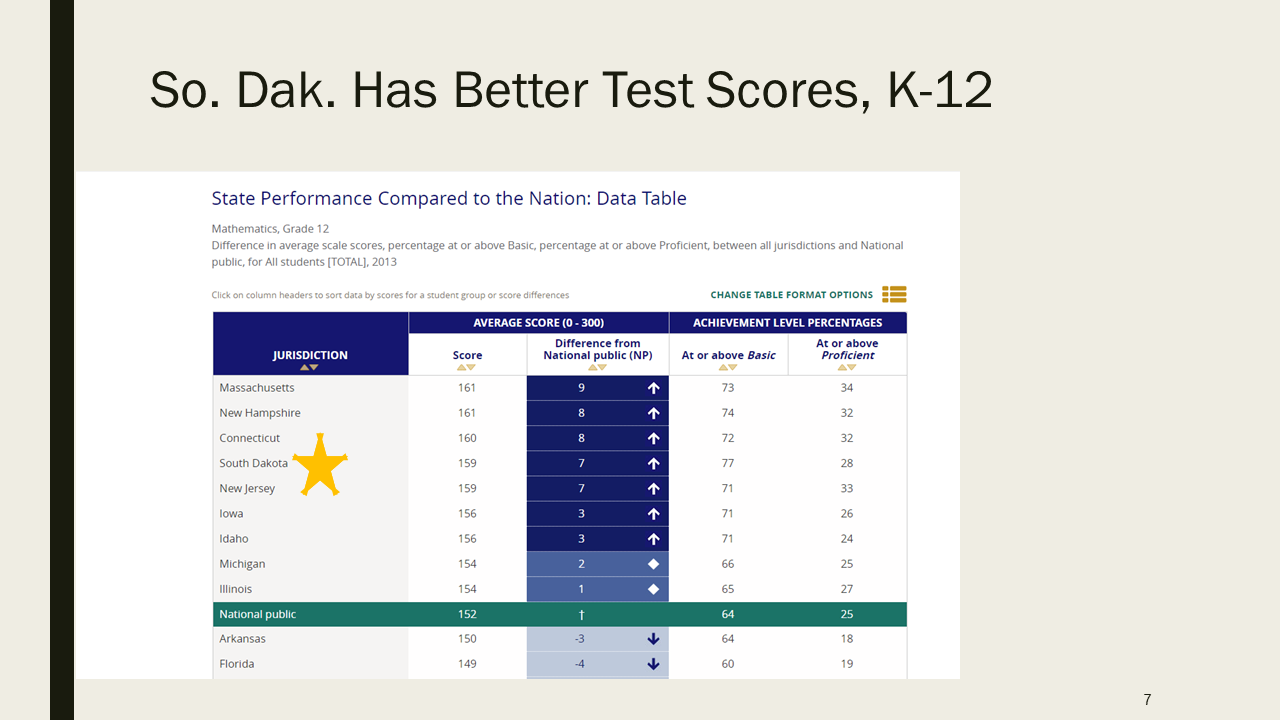
And, contrary to stereotypes based on inputs (teacher salaries)
instead of outputs (student learning), South Dakotans are not appreciably
dumber than Pennsylvanians. In 2013, for example, South Dakota high school
seniors scored 4th highest in the country in mathematics. That same year,
though, they stumbled in reading, coming in only 5th nationally, a mere 20
places ahead of Pennsylvania.
The second hypothesis also fails under close scrutiny as
South Dakota’s economic freedom score in all three major areas of government
spending, taxes, and labor market freedom are superior to those of Pennsylvania
and have been since 1981, with only the very slight and very recent exception
of labor market freedom, which is Pennsylvania’s freest area since the demise
of private sector unions in steel and coal. Meanwhile, South Dakota slipped in
the labor freedom category by enacting a state minimum wage above the federal
one and indexing it to inflation.
That leaves us with the third hypothesis, that economic
freedom is lower in South Dakota than reported, or rather that the population
that enjoys a freedom score of 8.0 is some 80,000 people lower than reported.
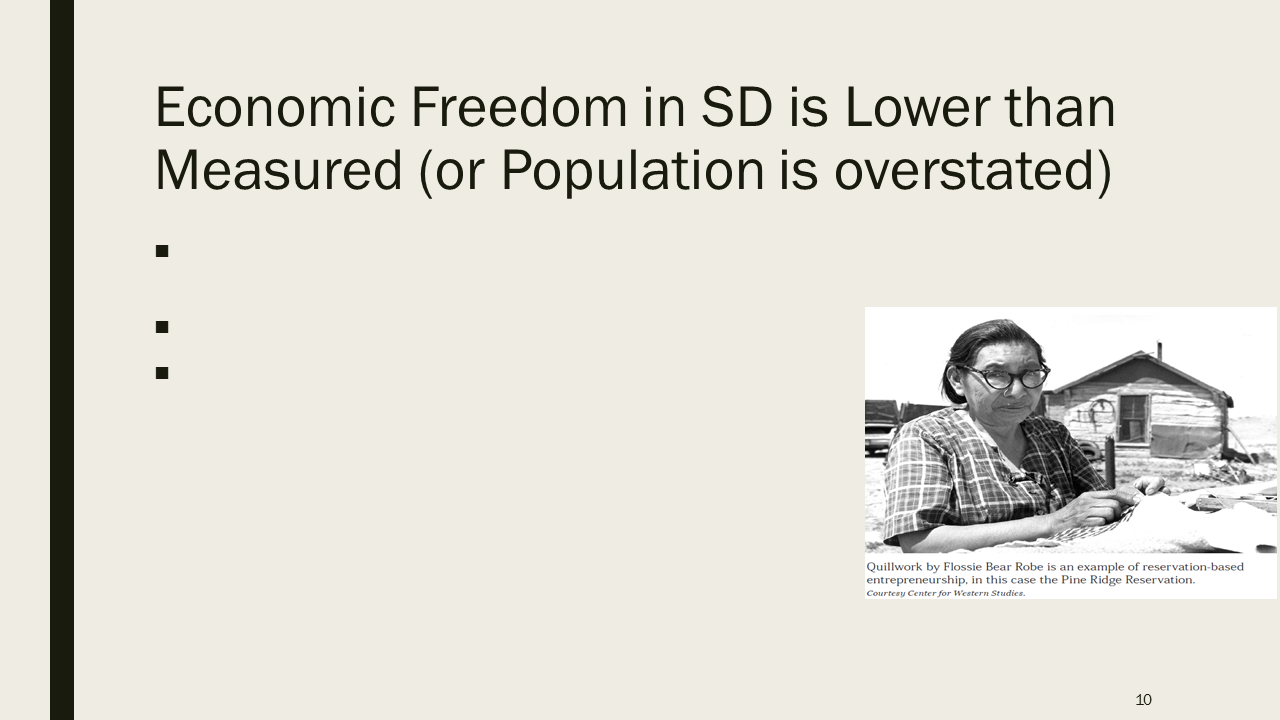
These are not due to measurement errors per se but rather to counting people
living on Indian Reservations. South Dakota has 8 Indian Reservations and the 3
huge ones located west of the Missouri River, to wit the Cheyenne River,
Rosebud, and Pine Ridge reservations, are desperately poor. Their denizens
basically live under socialism and hence have very little economic freedom. The
Bureau of Indian Affairs is a central planner run amok and Indian Health
Services is socialized medicine at its worst. Most damning of all, Reservation
Indians have little access to decent financing because the land tenure system
on the Reservations is completely different from that of the rest of the
country and the criminal justice system is even more farcical. Any way you
slice it, Indian Reservations, which have per capita incomes of $10,000 or so,
drag down the state averages. Remove the three poorest counties in the state,
which are perennially among the poorest in the nation, Ziebach, Todd, and
Oglala Lakota, from the state’s income statistics and South Dakota’s per capita
income exceeds that of Pennsylvania by almost $3,000, an appropriate figure
given the state’s higher economic freedom score.
Conversely, if that thought is too jarring for a
Pennsylvania audience, we need to lower South Dakota’s economic freedom score
to account for the fact that a large percentage of its population subsists at a
level of economic freedom at best half that of the rest of the state. In that
case, Pennsylvania has a higher per capita income than South Dakota but is also
more economically free, on average.
If the issue of the dearth of economic freedom in Indian
Country interests you, I supply many more details in my 2015 book, Little
Business on the Prairie, which is a history and policy analysis of
entrepreneurship in South Dakota from 10,000 BC to the present. You can buy a
copy when you visit South Dakota’s Badlands, Mount Rushmore, or Crazy Horse
monuments or just want to hunt dinosaurs. If a trip to South Dakota is not on
your bucket list, though, you can pick up a copy on Amazon.
Thank you!